icons
fading-image

Reporting & Analytics

Custom-built. Actionable. Backed by complete rail network visibility.

Whether you're tracking railcar mileage for taxes, evaluating component performance, or monitoring fleet health, TransmetriQ delivers clear answers with on-demand or scheduled reports designed by our in-house data and analytics experts.

Movement Reporting

Common Use Cases:

  • Mileage Analysis & Speed Studies: Validate how long railcars spent in each state for ad valorem tax reporting. Monitor distance traveled to normalize repair costs or evaluate equipment utilization
  • Lease Usage Monitoring: Track against mileage caps for lease agreements. Get insight into prior movement history before accepting delivery
  • Cycle Time Reporting: Compare terminal efficiency across facilities to minimize bottlenecks, reduce idle time, and optimize for just-in-time production

  • Aggregate Commodity Movement: Gain insight into regional and national commodity flow trends. Market analysts, car manufacturers, and investors use this data to forecast demand shifts and support strategy

  • Delivered as: PDF, spreadsheet, or integration
Analytics Cycle Time and Dwell-1
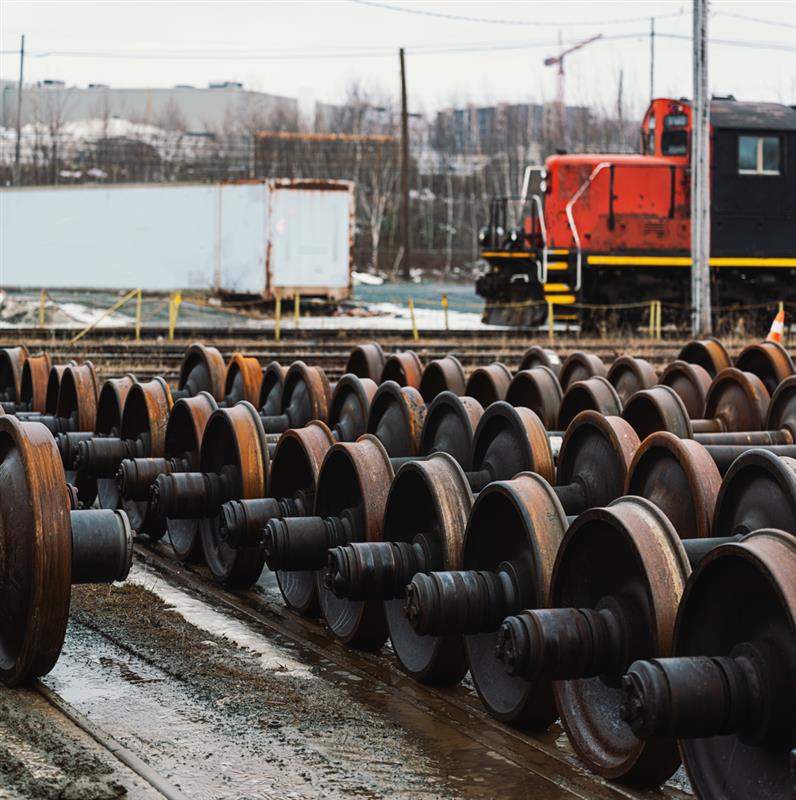
Rail wheel garden

Equipment Health Reporting

A unified view of fleet mechanical health—wherever it is.

   Inbound Equipment Health: (For Railroads)
Identify cars with potential defects before accepting interchange

   Online Equipment Health: (For Railroads)
Easily keep track of the health of equipment in your possession

   Fleet Health Reporting: (For Car Owners)
Monitor your fleet’s mechanical condition no matter where it is in the network

  Consolidated Asset Reporting System:
API-enabled health and spec reporting 

Delivered as: PDF, spreadsheet, or API
Helping car owners, fleet managers, and component manufacturers make informed decisions

Performance Analysis:

  • Evaluate performance and lifespan of railcar components
  • Compare equipment types to guide procurement or replacement
  • Meet reporting requirements for component approval bodies
  • Delivered As: PDF or spreadsheets (data sets)
Custom Reports V2 (2)
Industry Data Extracts (4)
Industry Data Extracts
Access your fleet's industry records
 
From car ownership and configuration to full billing history, TransmetriQ helps you obtain historical and current records straight from the industry systems of record.
 

Popular Extracts:

   Umler® equipment characteristics

   Car repair billing history

   Age of freight / fleet age distribution
 
Delivered As: Spreadsheets (data sets)


Need something specific? Our data science team builds it.

Custom Reports:

When our standard report offerings don’t fit your needs, we can create custom reports to answer one-time or recurring needs.
 
  • Intermodal Lane Reports
  • Historical CLM reports
  • Umler® file pulls
  • Tax filing documentation (speed studies, mileage)
  • Commodity movement by lane or region
  • Ad hoc business intelligence reports
  • Delivery Options: One-time or recurring (daily, weekly, monthly, yearly)
Custom Reports V2 (1)

Why TransmetriQ

What drives the majority of your repair spend? Which leased assets perform the best? Answering these questions requires integrating large datasets from many sources. That's why TransmetriQ provides done-for-you reporting:

  • The only platform with full visibility into North American freight rail—including historical breadth and depth you won’t find anywhere else.
  • Reports created by in-house engineers & analysts.Reports from TransmetriQ aren't a snapshot of a moment in time. Your repair cost drivers and fleet trends change over time. We keep your reports updated with the most recent data, ensuring you make decisions on the most accurate insights available.
  •  Delivered in formats that integrate with your ERP and planning tools
  • Supports everything from tax compliance to market intelligence